Tuesday, March 24, 2009
The composition of debt
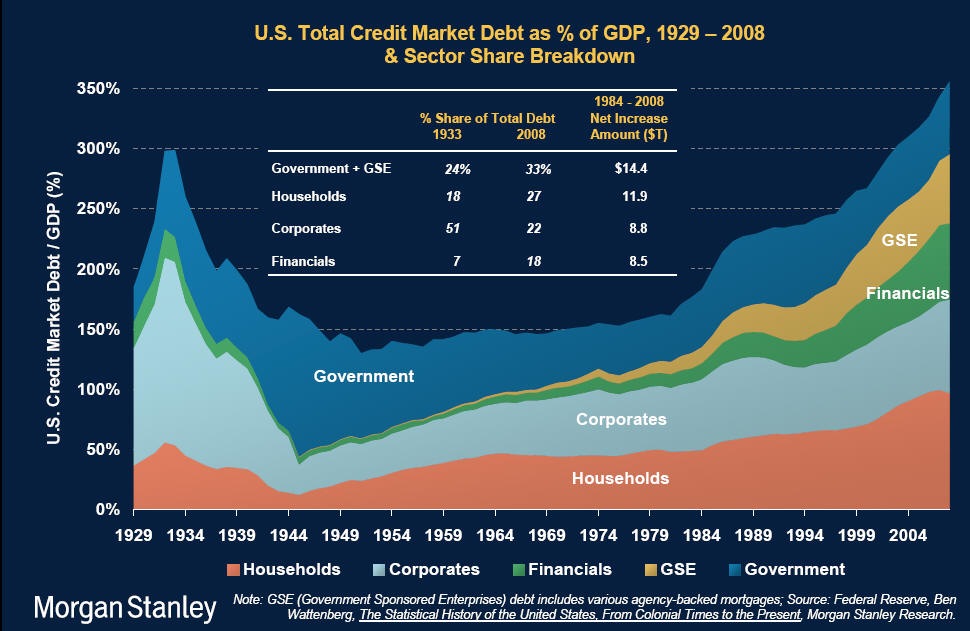
Via Paul Kedrosky, an interesting graph that shows the composition of American debt over time as a percentage of GDP. Corporate debt -- you know, the stuff incurred by those greedy corporate tools -- is substantially lower as a percentage of the total in 2008 compared to 1933. Government debt (including the GSEs, pre financial rescue) is up from 24% to 33%, or an increase of 38%. Household debt is up 50% as a proportion of the GDP, from 18% to 27%. Finally, financial debt, owing in no small part to the revolution in financial instruments in the last 30 years, is up a whopping 157% compared to 1933, from 7% to 18%.
There is more than enough "fault" to go around.
2 Comments:
By  , at
Wed Mar 25, 01:41:00 AM:
, at
Wed Mar 25, 01:41:00 AM:
"There is more than enough "fault" to go around."
How true.
You have to wonder why a State like California, with a economy equal to Italy, doesn't have 20 billion dollars in the bank to start repairs after the next earthquake. How is this a bad plan?
By , at
Wed Mar 25, 01:59:00 PM:
Just as interesting would be a chart showing the ownership of that debt over time, as well as currency ownership. How many dollars do foreigners now own? And, what percentage of all the debt represented on that chart do they also own.
Anyone who thinks we can ignore our creditors isn't really thinking....
![]()