Monday, February 16, 2009
The national debt load, by category
I stumbled across the following interesting graph in a deck of slides from a financial institution. It shows American national debt as a percentage of GDP by category, and how it has grown in the last two decades. As you can see, the growth in mortgage debt outweighs all the other categories by a longshot, including non-mortgage consumer debt and even government spending (which did not grow as much as one might have thought during the Bush years). Click on the graph for better resolution.
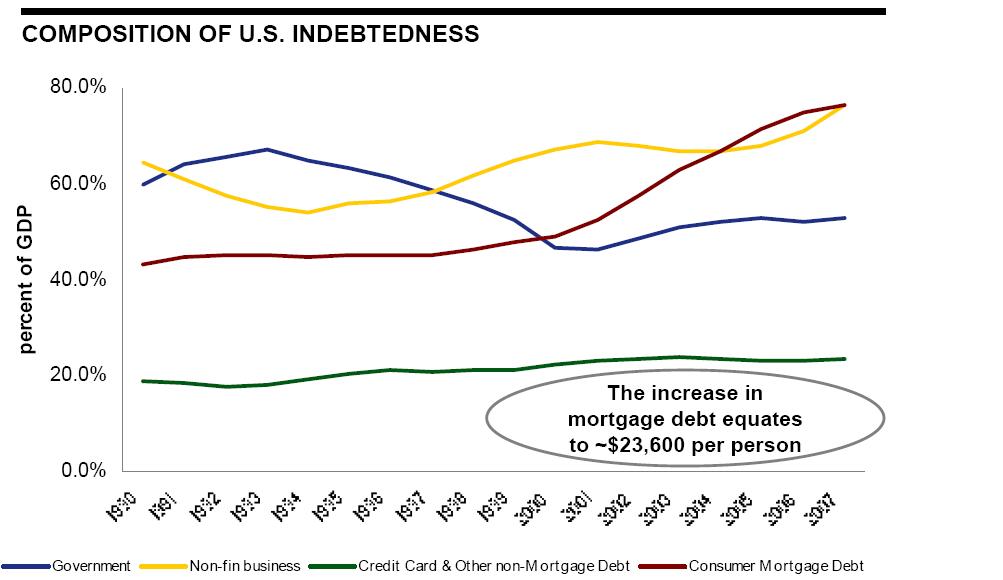
The money went into houses, or through houses into consumer spending via home equity loans (which probably explains why non-mortgage consumer debt did not go up much as a percentage of GDP even as consumer spending was driving the economy -- mortgage borrowing was covering the difference).
2 Comments:
By  , at
Mon Feb 16, 03:52:00 PM:
, at
Mon Feb 16, 03:52:00 PM:
My income got to a place where a credit card was useful just about the time that the tax deduction for credit card interest was eliminated. How much of our current mortgage debt was pushed there by it's detectability?
By , at
Mon Feb 16, 08:20:00 PM:
The Clinton's did it. Really, it's true!
![]()